AI Dashboard Layout for Shopify Seller Analytics: A Practical Guide

An ai dashboard layout for shopify seller analytics should answer one question fast: is my store healthy today, and what do I fix first? This guide shows you how to plan that layout, choose the right widgets, and build a clean screen you can hand to a developer or test with real sellers.
Start with the questions the dashboard must answer
Before you touch any layout, write down the decisions a seller makes each day. Most Shopify sellers check the same handful of things: sales vs. yesterday and last week, orders waiting to ship, conversion rate, traffic sources, top products, and anything that is going wrong (stock-outs, failed payments, refunds).
A good dashboard is built around those questions, not around the data you happen to have. If a chart does not change a decision, it does not belong above the fold.
A simple priority list
- Must see at a glance: revenue, orders, average order value, conversion rate
- Check every day: fulfilment queue, low-stock products, refunds
- Check weekly: traffic sources, cohort repeat rate, product margins
- Drill-down only: individual order details, raw session logs
Choose a clear grid structure
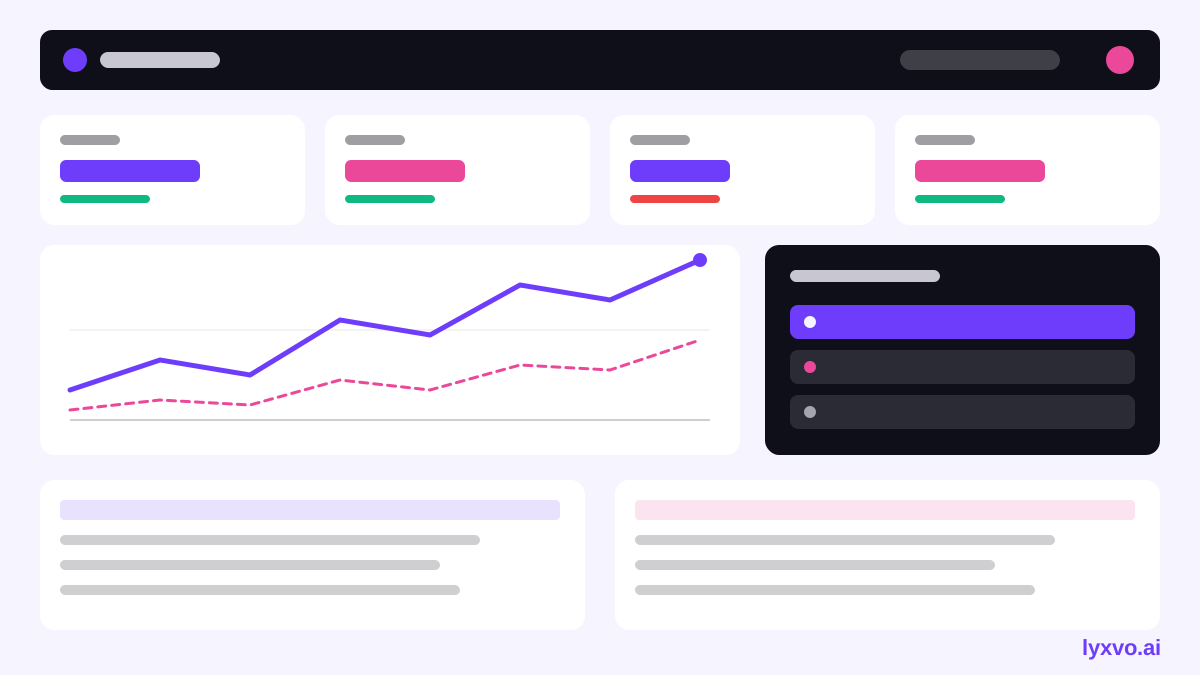
For desktop, a 12-column grid works well. Use this structure from top to bottom:
- Header bar: store name, date range picker, comparison toggle (vs. previous period)
- KPI row: 4 to 6 large number cards, each with a small trend line
- Main chart: one primary time series (revenue or orders) spanning most of the width
- Action panel: a short list of items needing attention (stock, shipping, disputes)
- Detail row: top products table and traffic source breakdown side by side
Keep the most important number in the top-left. On mobile, stack the same blocks vertically and keep the KPI row as a horizontal swipe.
| Zone | Width (desktop) | Content |
|---|---|---|
| Header | 12 cols | Store, date range, compare |
| KPI row | 12 cols, 4 to 6 cards | Revenue, orders, AOV, conversion |
| Main chart | 8 cols | Revenue over time |
| Action panel | 4 cols | Items needing attention |
| Detail row | 6 + 6 cols | Top products, traffic sources |
Design the widgets with restraint
Each widget should show one message. Practical rules:
- Use one accent color for positive or negative change, and keep the rest neutral grey.
- Show the comparison period beside every number so a seller never has to guess.
- Label units directly (currency, %, count) rather than hiding them in a legend.
- Replace pie charts with sorted bar charts. They are easier to compare.
- Give every empty state a next step, such as "Connect your ads account to see acquisition cost."
Note: Shopify's own admin and app ecosystem change over time. Check current Shopify API and app data availability before you promise a specific metric, since availability can differ by plan and region.
Use AI to speed up the layout work
AI helps most at two stages: generating several layout options from a brief, and producing consistent components. Describe the seller, the store size, the top five questions, and the device, then compare three variants side by side. Keep the one that makes the primary metric easiest to read, then test it with two or three real sellers.
How to build it in Lyxvo AI
Lyxvo AI's design agent can plan and design complete app and web screens for iOS, Android and web. To prototype a seller dashboard:
- Open the AI UI design generator or the AI app design tool, and choose the web platform for a desktop analytics view or the app platform for mobile.
- Describe the dashboard in plain language: the KPI cards, main chart, action panel and detail tables from the grid above.
- Review the generated screens, then use the Canva-style editor to change text, colors and card order directly.
- Export to Figma (SVG and tokens) so your developer receives the same spacing and colors, or export HTML, Flutter or Kotlin Jetpack Compose code for the chosen platform.
For a full multi-page analytics product, the Lyxvo Engine handles whole apps and websites and is rented separately; every account can try two pages free. Pricing is on the pricing page.
Test the layout before you build it
Run a quick five-task test with real sellers:
- Find yesterday's revenue and compare it to last week.
- Name the product with the most refunds this month.
- Find which items need shipping today.
- Tell whether conversion went up or down, and by how much.
- Find where to set a date range.
If a seller takes more than ten seconds on any task, move that widget higher or simplify its label. Re-test after each change.
Common mistakes to avoid
- Too many KPIs. More than six cards dilutes attention. Move extras into a detail tab.
- Unlabelled comparisons. "+12%" means nothing without the period it compares to.
- Charts without a takeaway. Add a short caption such as "Revenue peaked on the Saturday sale."
- Ignoring mobile. Many sellers check orders on their phone; design the action panel to work at small width.
Summary checklist
- [ ] Listed the top five daily decisions a seller makes
- [ ] Built a 12-column grid with header, KPI row, main chart, action panel and details
- [ ] Limited KPI cards to four to six, each with a comparison
- [ ] Used one accent color for change and neutral greys elsewhere
- [ ] Designed empty states with a clear next step
- [ ] Tested five tasks with real sellers and iterated
- [ ] Exported specs or code for development
Once the layout is settled, you can also create supporting material such as a presentation for stakeholders or a social media post announcing the new dashboard to your merchants.
Try it in Lyxvo AI
Describe it in your own words and the design agent starts on the right flow. Free to start.
Related tool: AI UI design generator for apps and websites
Whole apps and websites are designed with the Lyxvo Engine, rented separately from the design plans; every account can try 2 pages free.