AI UI for a Language School Student Progress Dashboard
An AI UI for a language school student progress dashboard turns lesson scores, attendance and speaking practice into a clear view that teachers and students can act on. This guide explains what to show, how to lay it out, and how to create the screens quickly with Lyxvo AI.
Why a progress dashboard matters for language schools
Language learning is gradual, and students often lose motivation because they cannot see how far they have come. A well-designed progress dashboard solves this. It shows a learner their trajectory, helps teachers spot who needs extra help, and gives the school a simple way to report results to parents or sponsors.
An AI-assisted interface can go further by highlighting patterns, such as a student whose listening scores rise while speaking stalls, and suggesting the next practice focus. The design job is to make that information readable at a glance, not to overwhelm people with charts.
Decide who the dashboard is for
Before drawing a single screen, define the users. Most language schools need at least two views:
- Student view: motivating, personal, focused on progress and the next goal.
- Teacher or admin view: denser, focused on cohorts, attendance and students at risk.
Keep them consistent in colors and navigation, but do not force one layout to serve both. A student does not need a table of 40 classmates, and a teacher does not need confetti.
Choose the metrics that actually matter
Track what changes behavior. A useful starting set for language learners:
| Metric | What it shows | Best display |
|---|---|---|
| CEFR or level estimate | Overall proficiency | Single badge with a progress bar to the next level |
| Skill scores (listening, speaking, reading, writing) | Balance across skills | Four-bar or radar summary |
| Weekly practice minutes | Consistency | Simple bar chart by week |
| Attendance rate | Engagement in class | Percentage with trend arrow |
| Vocabulary mastered | Learning volume | Counter with recent additions |
| Next goal | What to do next | One highlighted card |
Avoid vanity numbers that go up without meaning anything. A recommended rule: every number on the screen should suggest an action.
Step-by-step layout for the student screen
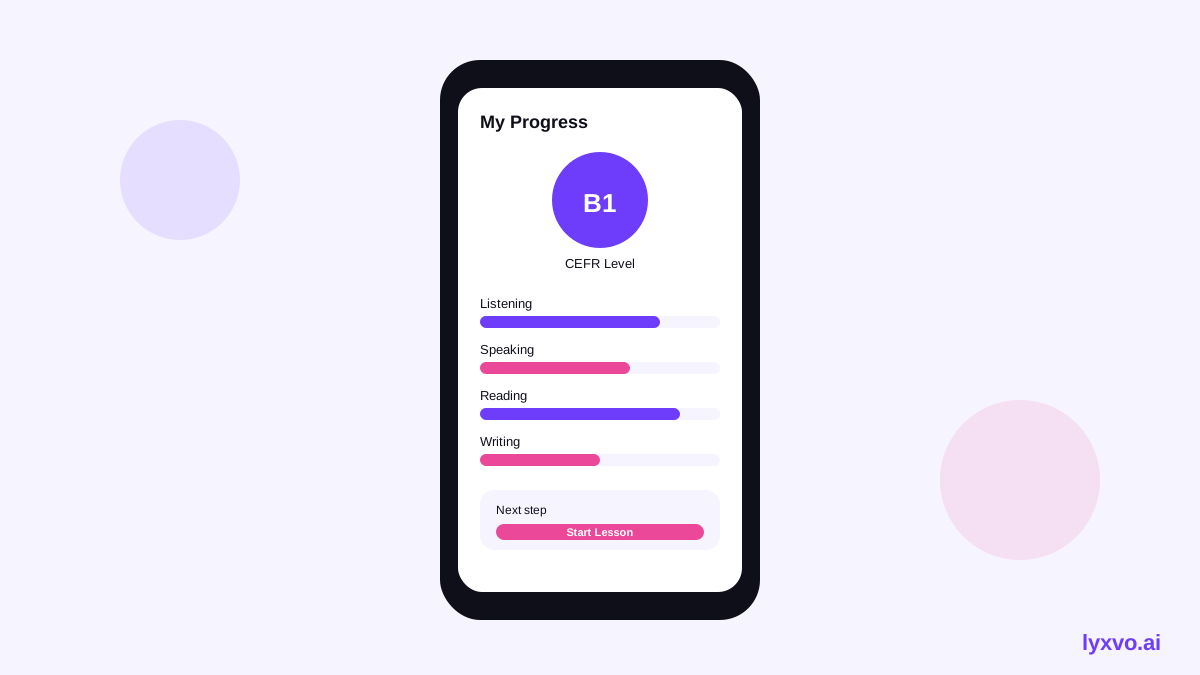
- Header: the student's name, current level and days until their next assessment.
- Hero card: one headline sentence, such as "You moved from A2 toward B1 this month," followed by a progress bar.
- Skill balance: four skills with short labels and one suggested focus.
- Activity strip: practice minutes for the last 8 weeks.
- Next step card: a single button, for example "Practice 10 minutes of speaking."
Keep text short and use plain language. Learners should understand the screen in under ten seconds.
Step-by-step layout for the teacher screen
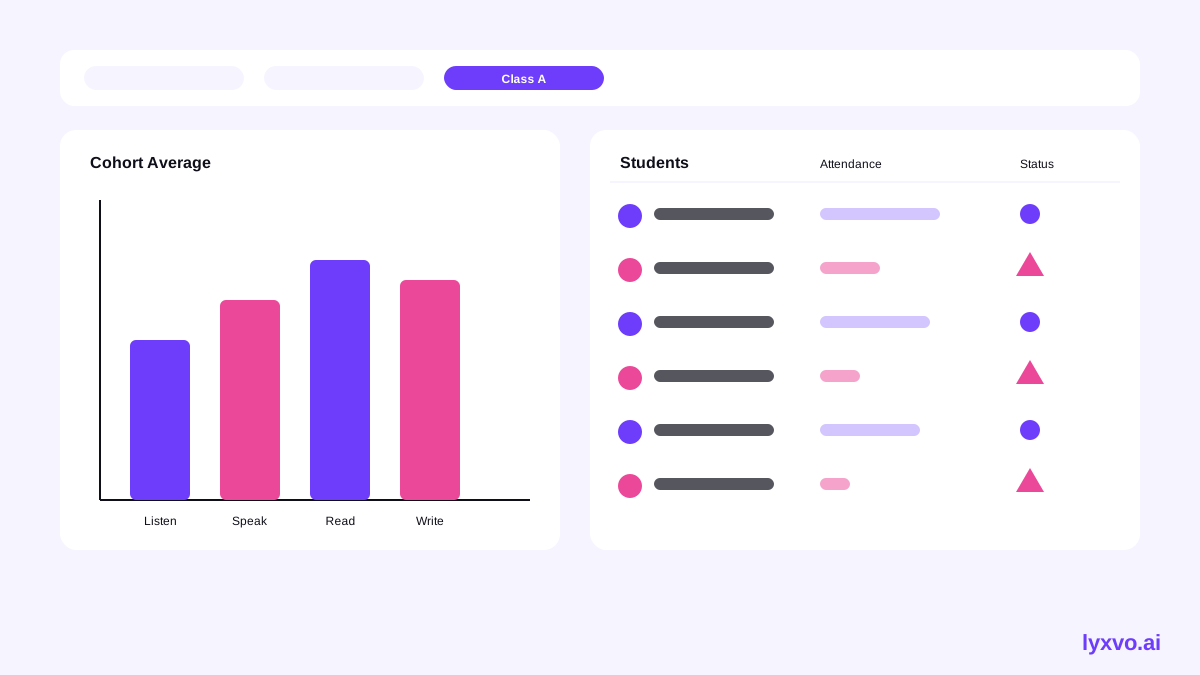
- Filter bar: by class, level and date range.
- At-risk list: students with falling attendance or flat scores, sorted by priority.
- Cohort chart: average progress per skill across the class.
- Student table: name, level, attendance, last activity and a flag column.
- Quick actions: send a message, schedule a check-in, or export a report.
Use color sparingly. Reserve red for genuine risk so teachers can scan quickly.
Using AI in the interface
AI adds the most value in three places:
- Summaries: a short paragraph per student, written in the student's preferred language.
- Recommendations: suggested exercises tied to the weakest skill.
- Alerts: notices when a pattern changes, such as three missed classes in a row.
Design these as suggestions with clear labels, and always let a teacher review or edit them before they reach a student or parent.
Checklist before you hand off the design
- Each screen has one primary question it answers.
- Every metric has a label a non-expert understands.
- Color is not the only way status is shown; add icons or text.
- Text meets readable contrast and the layout works on a phone.
- Empty states explain what will appear once there is data.
- Teachers can export or share a report in two clicks or fewer.
How to create this dashboard in Lyxvo AI
Lyxvo AI includes an AI design agent that plans and designs complete app and website screens for iOS, Android and web. To start a dashboard concept:
- Open the AI UI design generator or go to the web or app design studio at /design/?platform=web or /design/?platform=app.
- Describe the two user roles, the metrics you chose above, and the tone you want, for example friendly for students and data-focused for teachers.
- Review the generated screens, then edit text, colors and images directly in the Canva-style editor.
- Use Magic Resize to adapt key screens to other sizes, and Translate to produce versions in the languages your students speak.
- Share the file with your team for real-time collaboration, then export to Figma (SVG and tokens) or as HTML or Flutter code, depending on your developers.
For a logo or brand colors to use in the dashboard header, the AI logo generator can help. Note that multi-page apps and full websites use the Lyxvo Engine, which is rented separately; every account can try 2 pages free. Check current plans on the pricing page, since limits and prices can change.
Test with real users before you build
A design is only finished once learners and teachers have used a prototype. Run short sessions with three or four students and two teachers. Ask them to find their next goal and to say what the lowest skill is. If they hesitate, simplify the screen.
Final thoughts
A strong AI UI for a language school student progress dashboard shows fewer numbers, explains them clearly, and always points toward a next step. Start with two roles, a short metric list and one clear action per screen, then refine with feedback. Lyxvo AI can speed up the drafts so your time goes into the learning experience itself.
Try it in Lyxvo AI
Describe it in your own words and the design agent starts on the right flow. Free to start.
Related tool: AI UI design generator for apps and websites
Whole apps and websites are designed with the Lyxvo Engine, rented separately from the design plans; every account can try 2 pages free.